27 Jun 2016
The City of Toronto’s open data portal has a frequently updated dataset with detailed information on all the licences issued in the city. I thought it would be interesting to look at the city’s coffee shops and examine the current landscape and how things have changed over the last 15 years.
Tim Horton’s
Tim Horton’s has always been the undisputed king of coffee in Toronto as evidenced by the numbers. 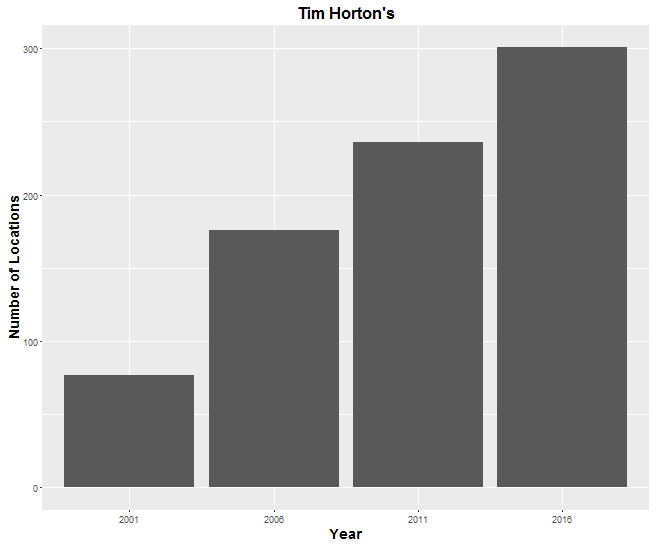 For the last fifteen years they have had a dominating presence across the city. There is a dense concentration of stores in downtown and the rest of the map is close to evenly distributed, with Tim’s locations popping up near most major intersections.
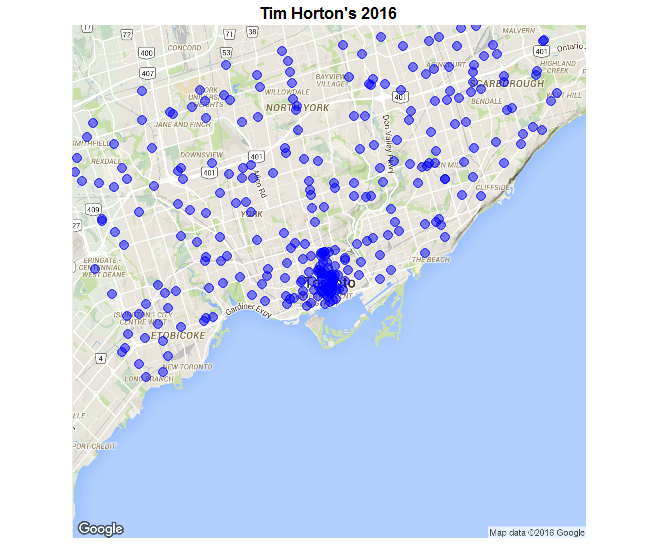
Starbucks
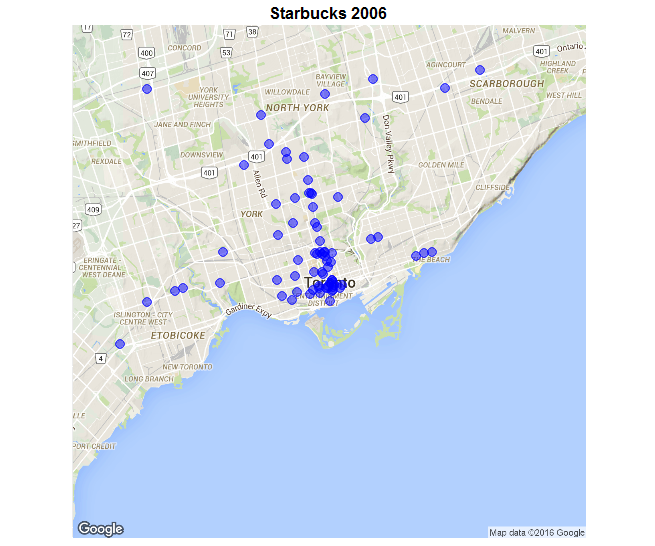
The last decade’s most notable development is the aggressive expansion of Starbucks. 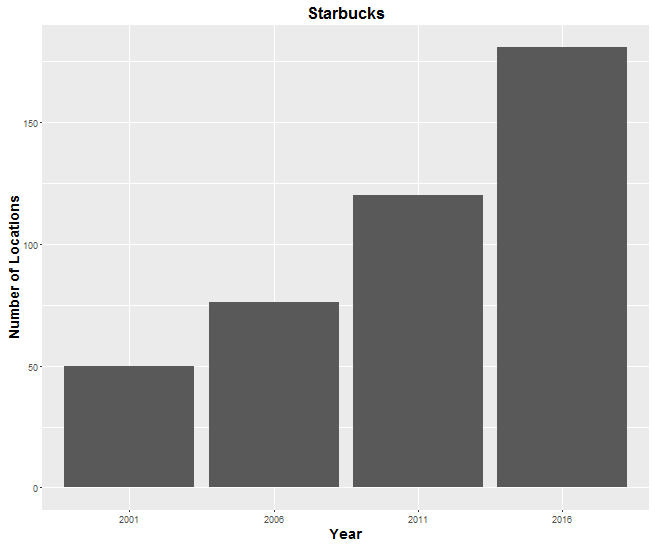 Tim’s can still claim superior breadth throughout the city. However, along the subway lines, in the downtown core, and in Toronto’s upscale neighbourhoods, Starbucks has caught and arguably surpassed Tim Horton’s.
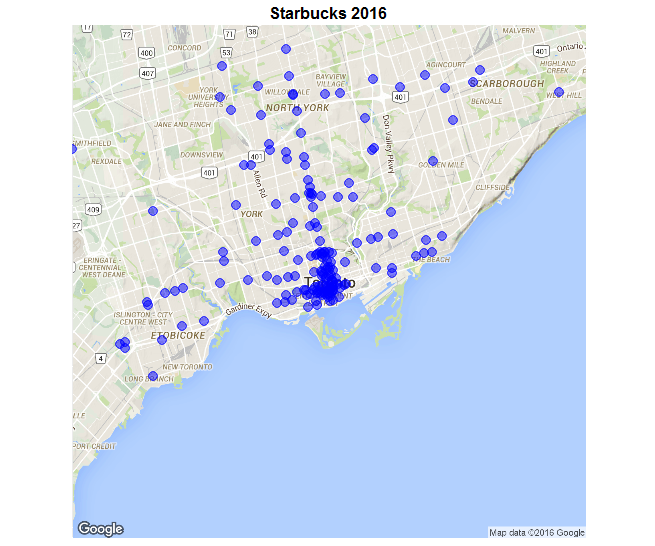 Comparing the current map, to maps from 2006 and 2011 you can see Starbucks has doubled down on their core demographic, leaving no wealthy area of the city uncovered.
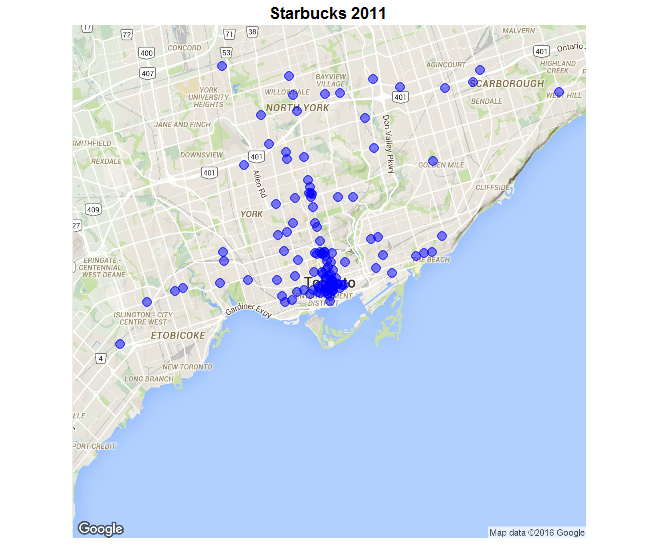
Upscale Mini Chains
Second Cup has long been a Toronto staple, growing incrementally with the city’s population. 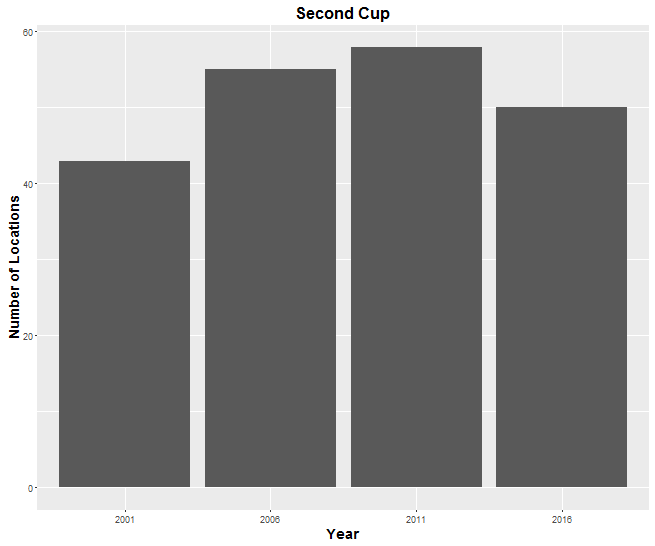 Their location strategy lies somewhere in between Tim’s and Starbucks, as they predominantly cater to a downtown/commuter base, but have also expanded into other areas.
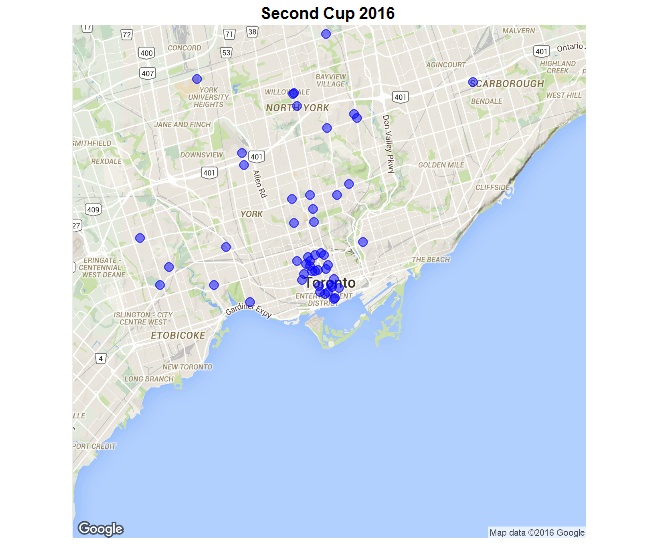
Alongside the rise of Starbucks, the last decade has seen the proliferation of niche coffee chains. Aroma Espresso Bar is a great example, five years ago it barely existed, now they are big enough to register as a portion of the market.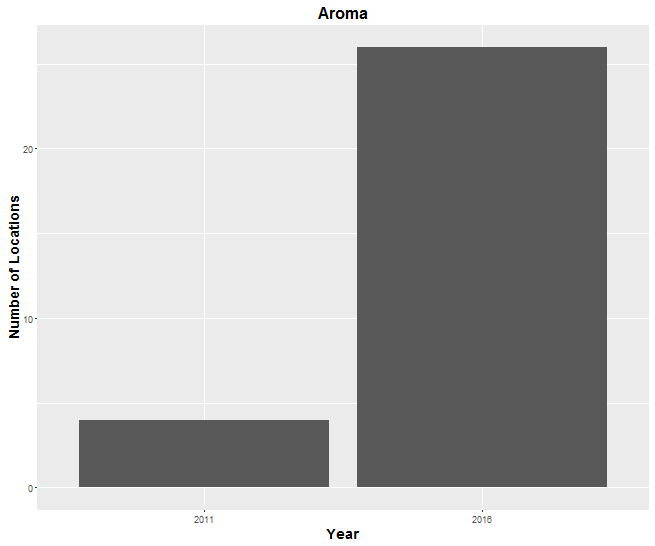 On a smaller scale, they have followed the same pattern as Starbucks, scattering locations downtown and along the subway.
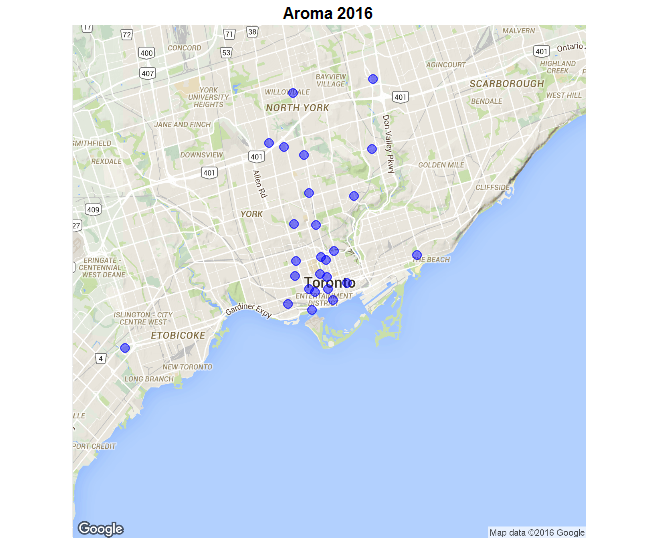
Losing Market Share
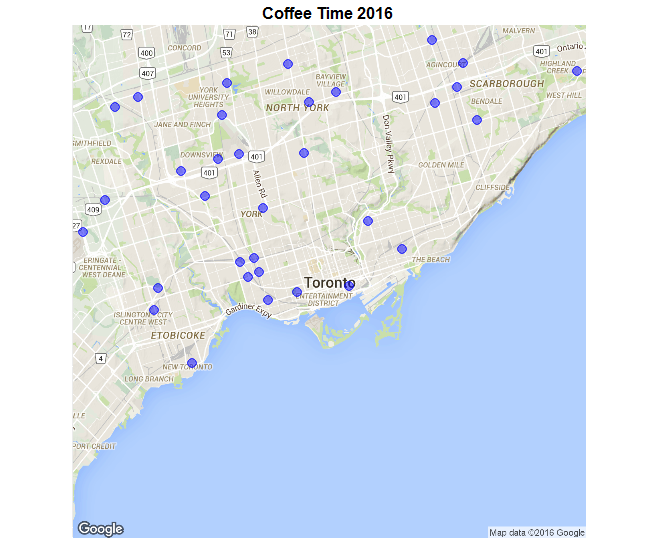
Two chains have struggled over the last decade with negative growth. Fifteen years ago, Coffee Time was Tim Horton’s biggest competitor. They have experience a significant drop off in locations each of the past five years. 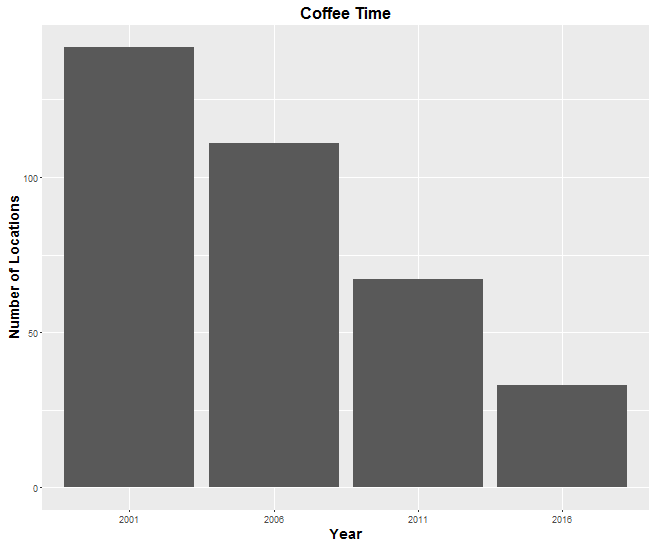
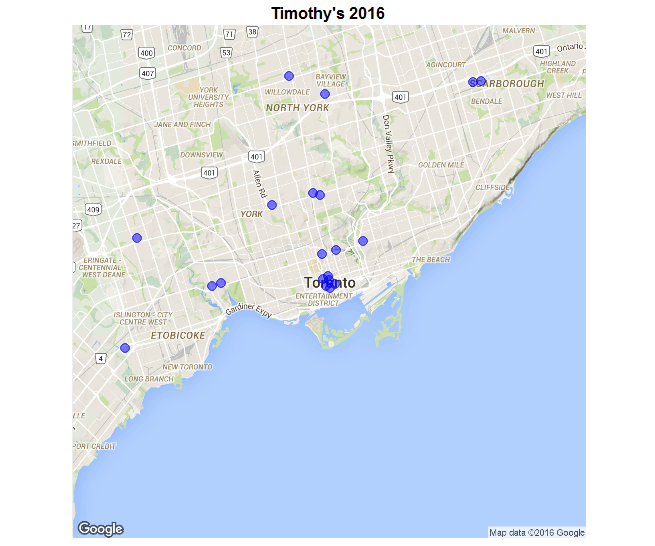
 Timothy’s has been the biggest loser in upscale locations, as niche brands and Starbucks have taken over.
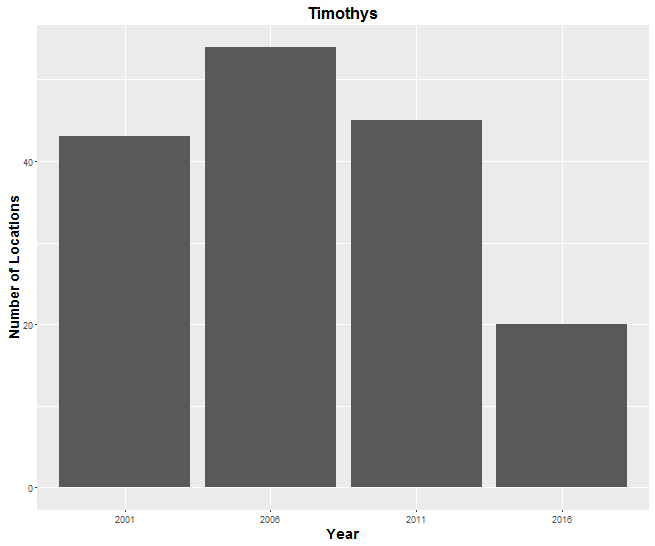
Other Competitors
All of this does not consider the rise of the independent coffee shop, which in trendier neighborhoods is a significant portion of the market. It also does not include places like McDonald’s, which in certain parts of the city is likely Tim Horton’s biggest competitor.
If you liked this post, you can
share it with your followers
27 Mar 2016
Expanding on my last post about Toronto’s most expensive parking tickets, I decided to dive back into the city of Toronto’s parking ticket data. Fire hydrant fines are another interesting type of infraction that have been very profitable for the city. In 2015, there were 32,791 tickets issued for parking within 3 meters of a fire hydrant. At $100 per ticket, that produced close to $3.3 million in revenue.
As expected, there are several fire hydrants that are cash cows for city hall. 393 University Avenue is the city’s most consistent revenue source. As you can see in the Google Street View below, the hydrant is well back from the street and tough to notice for the average driver. This hydrant has topped 290 tickets each of the last three years, with a high of 557 tickets in 2013.
393 University Avenue
In 2015, 99 Atlantic Avenue surged to the top of the list with 419 tickets issued, grossing $41,900 in revenue. It is in an area of increased activity, in which the color of the hydrant can sometimes blend into the burned grass that it sits on.
99 Atlantic Avenue
There were several other high grossing hydrants in Toronto that were similarly ambiguous. Continuing the University Avenue theme, the hydrant near 361 University Ave, also sits back from the street and tends to confuse Toronto drivers. In 2015 it saw 270 tickets issued for $27,000 in fines.
361 University Avenue
At 56 The Esplanade this hydrant tends to blend in with a cluttered and active neighbourhood. The address has seen 180 tickets issued every year since 2013, bringing in annual revenue of $18,000+ .
56 The Esplanade
Similarly, 592 Markham St is another hydrant, slightly back in a busy street area. Over 200 tickets were issued in 2015, for just over $20,000 in revenue.
592 Markham St
If you liked this post, you can
share it with your followers
10 Mar 2016
Yesterday, the City of Toronto released their 2015 parking ticket dataset detailing raw information on every parking ticket issued last year in the city. Inspired by the fantastic I Quant NY blog, I started exploring the data to search for interesting trends. I also used the 2013 and 2014 datasets to compare results year over year.
I decided to start by looking into the tickets issued for the city’s max fine of $450. These tickets are given for several variations of parking illegally in a handicapped zone. Some of the most frequently cited addresses make intuitive sense: 555 Rexdale Blvd (Woodbine), 1090 Don Mills Rd (Shops at Don Mills) and 3401 Dufferin St (Yorkdale). All are large crowded areas where drivers might try to get away with parking in handicapped spots.
But, most of the city’s biggest cash cows are more obscure spots that have consistently flummoxed Toronto drivers. Toronto’s undisputed king of max fine parking tickets, doubling any other address in the city, is 410 College St. In 2015 alone, 796 tickets were issued for a total of $358,200. This is not a one year aberration. The spot generated $401,850 in 2014 and $291,150 in 2013. It is tough to tell, but you can judge what is causing the issue for yourself with the Google Street View image below (in which a likely victim is parked in the spot).
410 College St
No other address in Toronto is as consistent a revenue producer as 410 College, but there are several other spots that seem to be a lock every year for $100,000+ in max fine ticket revenue. 18 Grenville St seems like another awkward place for a handicapped designation. In 2015 the spot averaged close to a max fine a day, 342 tickets for $153,900. Each of the last three years max fines at 18 Grenville have topped $145,000.
18 Grenville St
Another Google Street View image with a likely victim in the still shot. This is across the street from 35 Balmuto just outside an eastside exit from the Manulife Center. This spot has topped $100,000 in fines the last three years with 2015 seeing 326 tickets for $146,700.
35 Balmuto St
The last of Toronto’s prolific max fine spots, 60 Murray St just west of Mount Sinai hospital. In 2015 this spot produced 287 tickets for $129,150, its lowest total of the last three years.
60 Murray St
If you liked this post, you can
share it with your followers